Purpose
Using ideacolors with ggplot2 allows you to
add IDEA’s or Camp RIO’s color palettes with familiar
ggplot2 syntax. These branding guidelines change
occasionally, and your visualizations will need to be adapated to use
the updated guidelines. However, if you are trying to reproduce a
visualization from an older branding guideline for consistency, then
you’ll need to override the default behavior of
ideacolors which uses the newest branding guidelines
available.
How it works
Suppose you have a visualization that uses an accent color, say
idea_colors_2019$magenta or
idea_colors_2024$vermillion, and you want to keep your
visualizations consistent between different reports. To specify the
branding guidelines for that visualization, you may need to use the
year argument.
Option 1: use the most recent guidelines available
If you do not need to use prior branding guidelines, common functions
like scale_color_idea(), scale_fill_idea(),
scale_color_camp_rio() and
scale_fill_camp_rio() will default to the most recent
guidelines available (in this case, 2024).
library(ggplot2)
library(ideacolors)

# uses most recent branding guidelines
cars <- ggplot(mtcars) +
  geom_histogram(aes(x = mpg,
                     fill = as.factor(cyl))) +
  scale_fill_idea()

cars
#> `stat_bin()` using `bins = 30`. Pick better value with `binwidth`.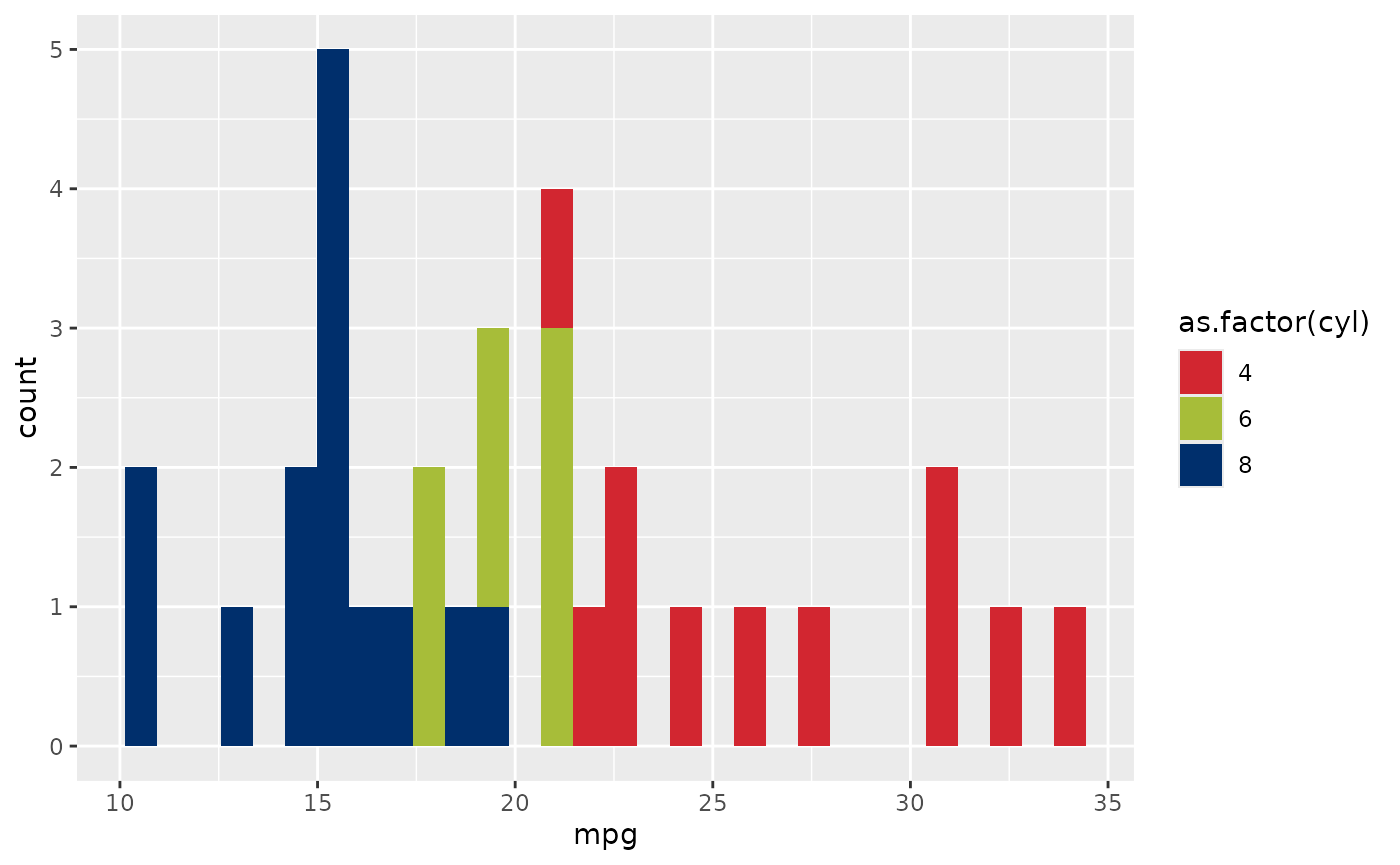
Option 2: explicitly specify branding guidelines
If you want to specify explicitly which guidelines you will use, then
add the year argument to the scale_*
functions. For example, using the 2019 guidelines would produce this
graph:
cars +
  scale_fill_idea(year = 2019)
#> Scale for fill is already present.
#> Adding another scale for fill, which will replace the existing scale.
#> `stat_bin()` using `bins = 30`. Pick better value with `binwidth`.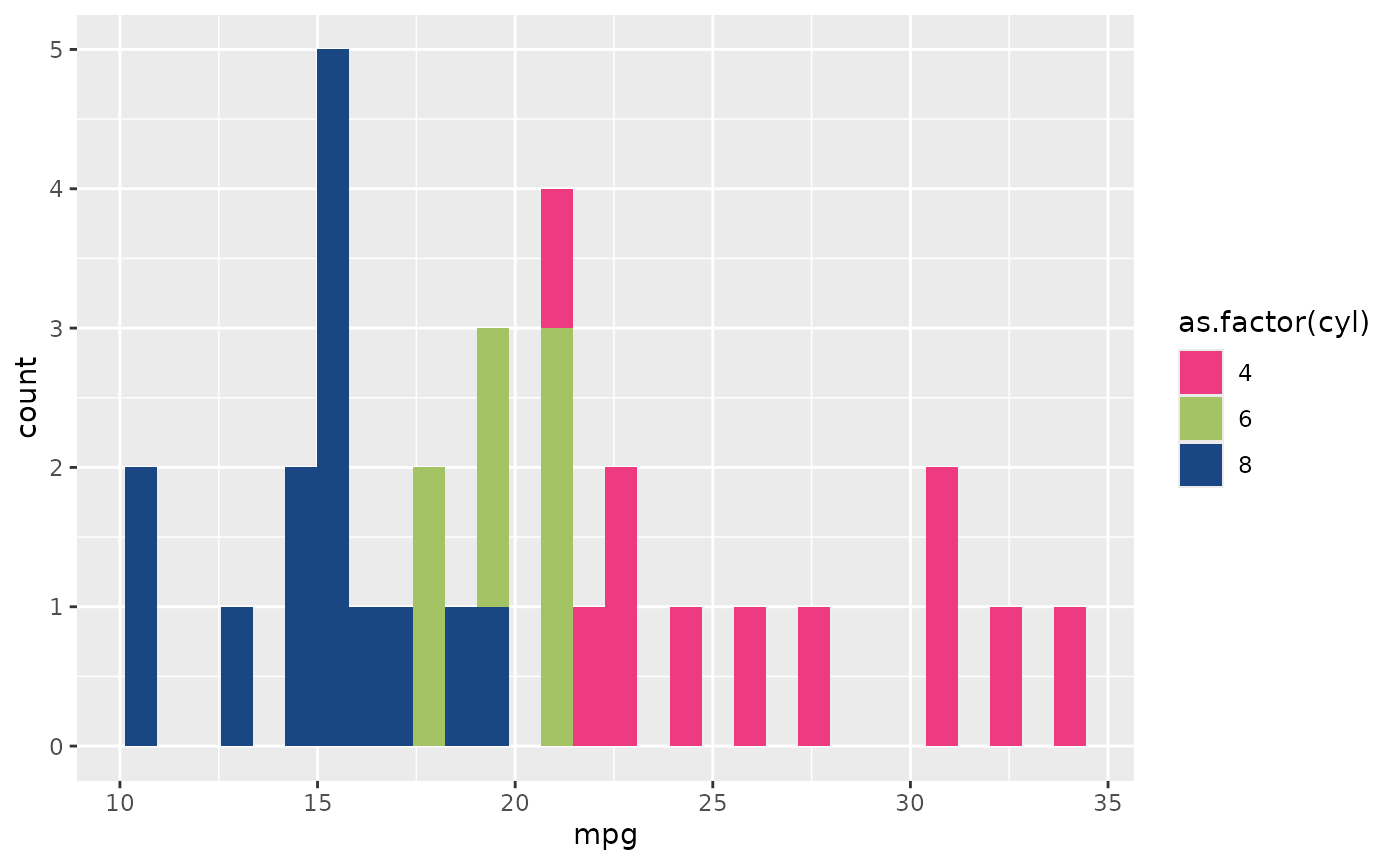
Note that using scale_fill_idea(year = 2024) would
produce the same graph using scale_fill_idea(), since those
are the most recent guidelines. Similarly, using
scale_fill_camp_rio(year = 2022) would be equivalent to
scale_fill_camp_rio(). If you specify a year without
branding guidelines available, then an error message will appear.
Option 3: use individual colors from each palette
If you needed to use an additional color from a different palette you currently use, you can always call each color independently:
my_palette <- c(
  "4" = idea_colors_2019$magenta,
  "6" = idea_colors_2024$darkblue,
  "8" = camp_rio_colors_2022$forestgreen
)

cars +
  scale_fill_manual(values = my_palette)
#> Scale for fill is already present.
#> Adding another scale for fill, which will replace the existing scale.
#> `stat_bin()` using `bins = 30`. Pick better value with `binwidth`.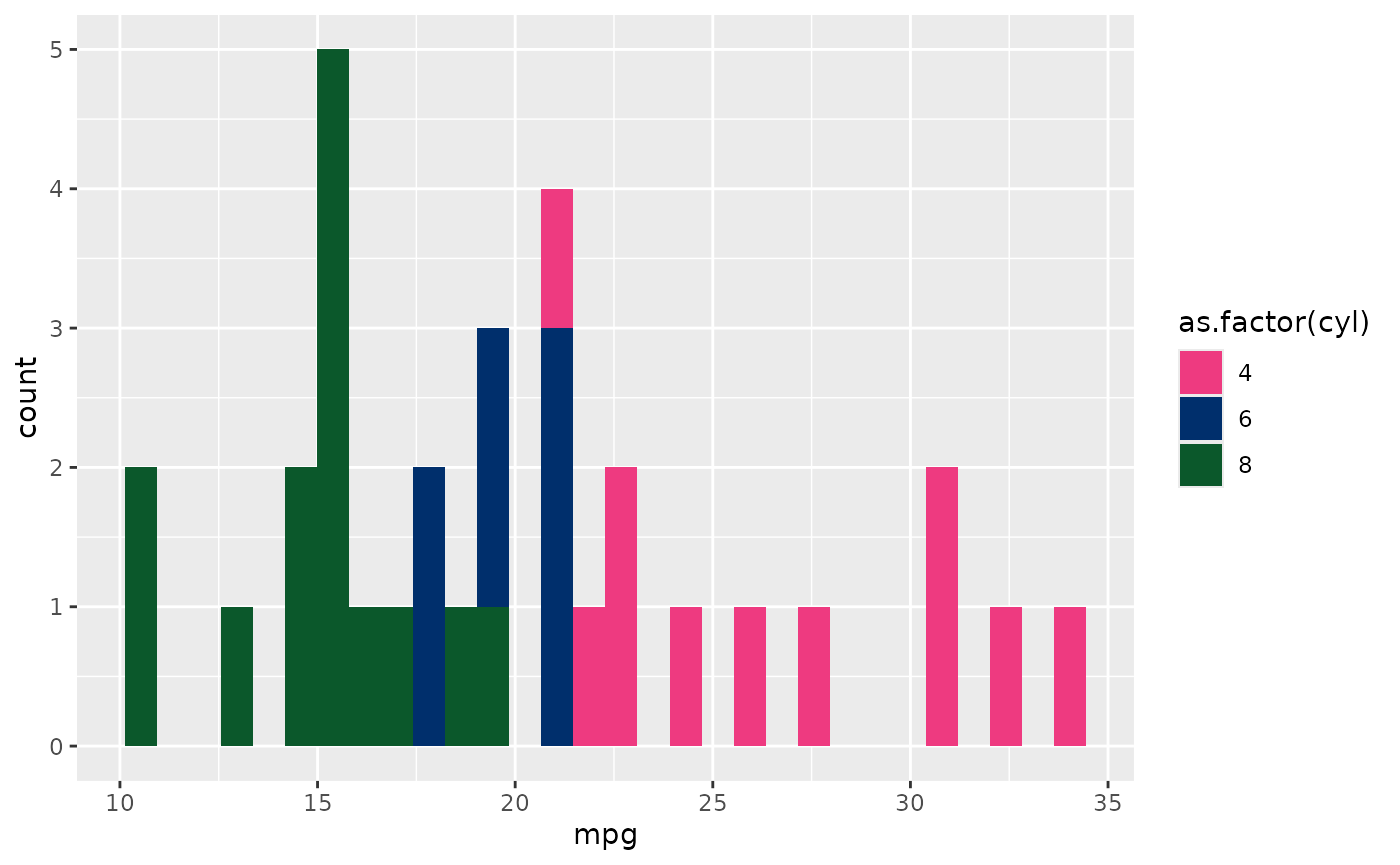
Of course, always choose colors that produce a coherent visualization, since randomly selecting a palette may not create an aesthetically pleasing graph.