A collection of color palettes based on the [IDEA Brand Guidelines (2024)](https://brandfolder.com/ideapublicschools) (you'll need to behind the firewall to see that guide).
Details
The list of available palettes is: * qual * div * blueorange * greenorange * bluegray * greengray * orangegray
Examples
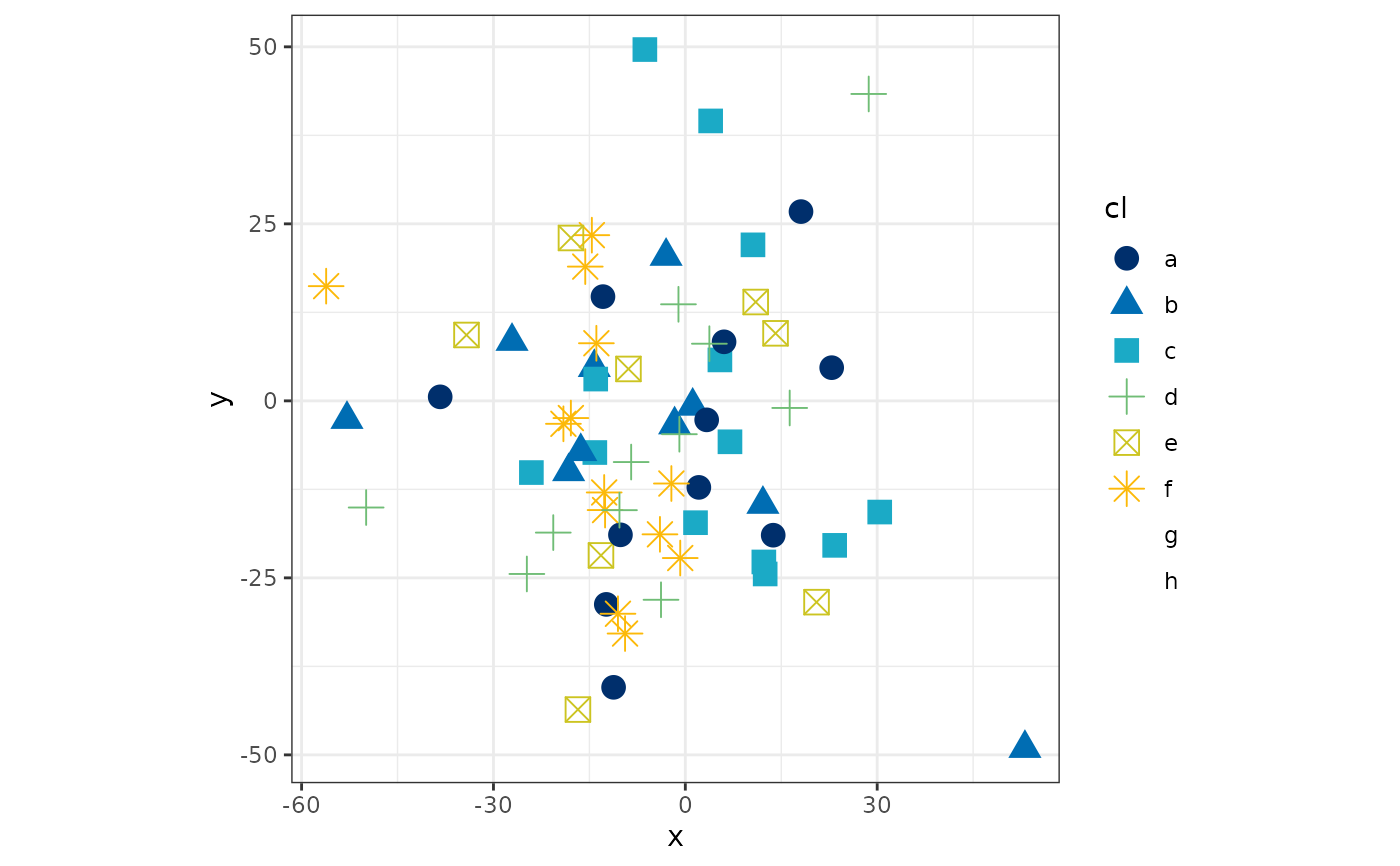
# Make an x-y plot using the div palette
library(tidyverse)
df <- data.frame(x = rnorm(100, 0, 20),
y = rnorm(100, 0, 20),
cl = sample(letters[1:8], 100, replace=TRUE))
ggplot(df, aes(x, y, colour=cl, shape=cl)) +
geom_point(size=4) +
scale_colour_idea() +
theme_bw() +
theme(aspect.ratio=1)
#> Warning: The shape palette can deal with a maximum of 6 discrete values because more
#> than 6 becomes difficult to discriminate
#> ℹ you have requested 8 values. Consider specifying shapes manually if you need
#> that many have them.
#> Warning: Removed 34 rows containing missing values or values outside the scale range
#> (`geom_point()`).
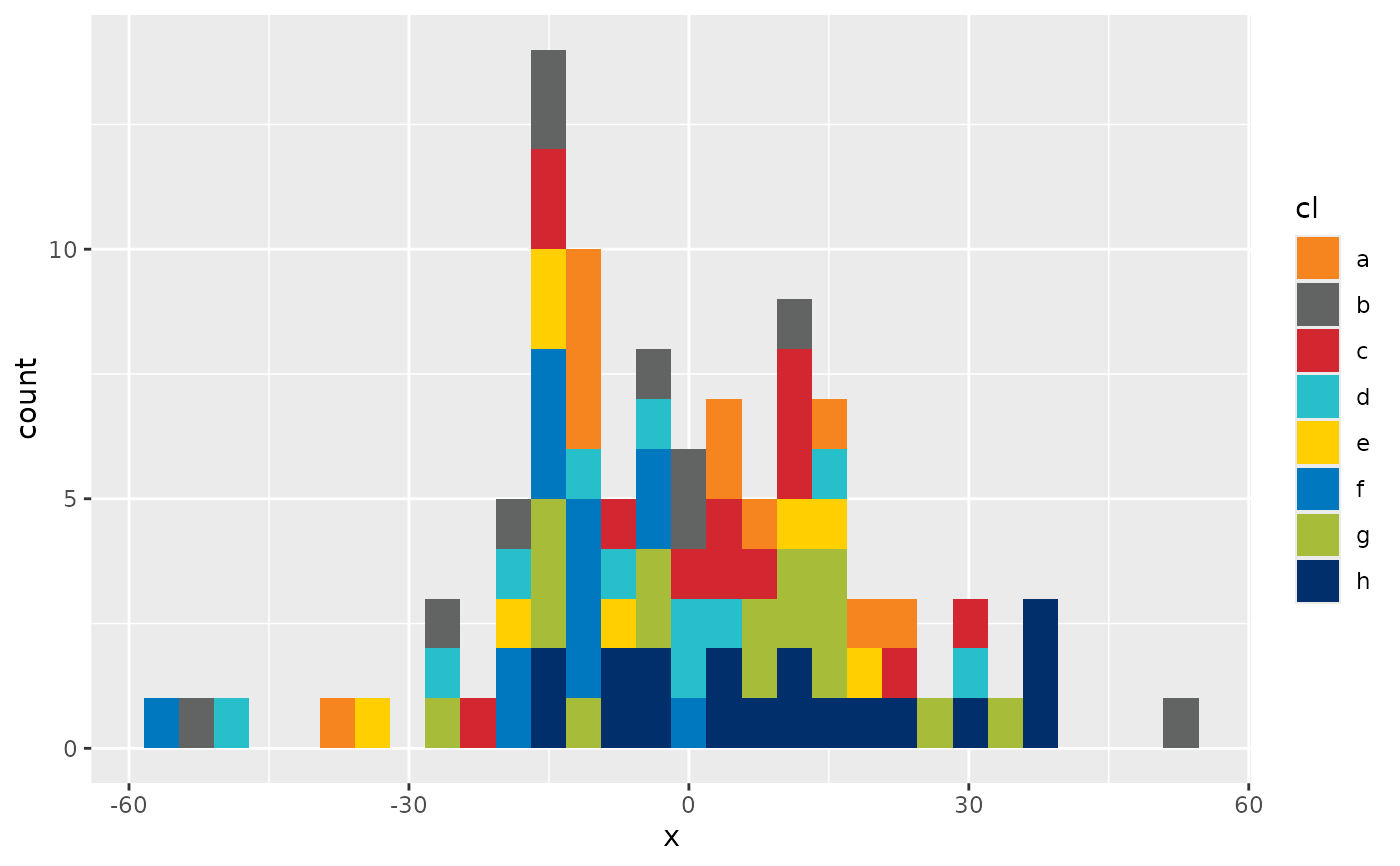
 # Make a histogram using the qual palette
ggplot(df, aes(x, fill=cl)) + geom_histogram() +
scale_fill_idea(palette="qual")
#> `stat_bin()` using `bins = 30`. Pick better value with `binwidth`.
# Make a histogram using the qual palette
ggplot(df, aes(x, fill=cl)) + geom_histogram() +
scale_fill_idea(palette="qual")
#> `stat_bin()` using `bins = 30`. Pick better value with `binwidth`.